The stress of creating a Japan itinerary for foreign travelers
Table of Contents
1:Comparison of time spent on household chores
2:Ratio of time spent making itineraries to disposable time
3:Issues specific to travel in Japan
4:Changes in travel purpose
1:Comparison of time spent on household chores
According to Hotels.com, 42% of global millennial travelers (generally defined as those born between 1981 and 1996) cite “planning a trip” as “one of the major stresses in their lives“. We would like to explore the reasons for this.
First, we looked at time spent on household chores around the world. The survey covered 19 countries for which data was available from the top 30 countries that visited Japan in 2019. According to World Development Indicators, “Proportion of time spent on unpaid domestic and care work”, the top three countries were Mexico, Italy, and Spain for women, and Sweden, New Zealand, and Mexico for men. We used the average hours for 2010-2019. Because each country announces a different year and the number of years.
At first, we divided the 24-hour day 0into three equal parts – eight hours of work, eight hours of sleep, and eight hours of leisure time. Next, we calculated the proportion of time spent on free housework and care to the eight hours of leisure time. We found the result that women in Mexico spent 86% of their leisure time on housework and care.

Time spent on unpaid housework/caregiving as % of 8 hours of leisure time (Women)
Hours Portion against leisure time Mexico 6.9 86% Italy 4.9 61% Spain 4.5 57% Russian Federation 4.4 55% New Zealand 4.3 54% Switzerland 4.0 50% Germany 3.9 49% Sweden 3.9 48% Belgium 3.8 48% France 3.8 47% United States 3.7 46% Canada 3.7 46% China 3.7 46% Netherlands 3.5 44% Korea, Rep. 3.4 43% United Kingdom 3.0 38% Brazil 3.0 37% Thailand 2.8 35% Hong Kong SAR, China 2.6 32% Average 3.9 49%
Time spent on unpaid housework/caregiving as % of 8 hours of leisure time (Men)
Hours Portion against leisure time Sweden 3.1 38% New Zealand 2.5 32% Mexico 2.5 31% Germany 2.5 31% Switzerland 2.5 31% Belgium 2.4 30% Canada 2.4 30% United States 2.3 29% France 2.3 28% Netherlands 2.2 28% Spain 2.1 26% Italy 2.0 25% Russian Federation 2.0 24% United Kingdom 1.7 21% China 1.4 18% Brazil 1.0 12% Korea, Rep. 1.0 12% Thailand 0.9 11% Hong Kong SAR, China 0.8 10% Average 2.0 25%
2:Ratio of time spent making itineraries to disposable time
The time taken to create an itinerary varies considerably from one data source to another: 8 hours according to Hotels.com, more than 12 hours according to HotelFriend and about 30 hours according to WorldTrips. So, on average, we can say that they spend around 20 hours on itinerary making.
Also, according to a VISA survey (2017), the average length of a trip was nine days and eight nights. This means that the time to create an itinerary per travel day is 53 minutes (8 hours divided by 9 days) based on Hotels.com’s 8 hours and 200 minutes (30 hours divided by 9 days) based on WorldTrips’ 30 hours.
If the time spent on unpaid housework and care for family members is deducted from the eight hours of leisure time and the remaining time (disposable time) is used to create itineraries, the average percentage of time spent creating itineraries in the 19 countries ranged from 22% to 66% for women and 15% to 55% for men. Women in Mexico may not be able to generate a time to create an itinerary in their remaining leisure time, ranging from 79% to 296%.
Time spent making itineraries as a percentage of disposable time (Women)
In case of 8 hours In case of 30 hours Mexico 79% 296% Italy 29% 107% Spain 26% 79% Russian Federation 25% 76% New Zealand 24% 74% Switzerland 22% 68% Germany 22% 67% Sweden 21% 66% Belgium 21% 65% France 21% 65% United States 21% 64% Canada 21% 63% China 21% 63% Netherlands 20% 61% Korea, Rep. 19% 60% United Kingdom 18% 55% Brazil 18% 54% Thailand 17% 53% Hong Kong SAR, China 16% 51% Average 22% 66%
Time spent making itineraries as a percentage of disposable time (Men)
In case of 8 hours In case of 30 hours Sweden 18% 68% New Zealand 16% 61% Mexico 16% 61% Germany 16% 61% Switzerland 16% 60% Belgium 16% 60% Canada 16% 60% United States 16% 59% France 16% 58% Netherlands 15% 58% Spain 15% 56% Italy 15% 56% Russian Federation 15% 55% United Kingdom 14% 53% China 14% 51% Brazil 13% 47% Korea, Rep. 13% 47% Thailand 13% 47% Hong Kong SAR, China 12% 46% Average 15% 55%
Thus, itinerary creation time takes up a large proportion of disposable time, which explains why it is “one of the major stresses in life”.
And according to Hotels.com, millennials get bored after just 40 minutes of researching travel information. Therefore, rather than researching each itinerary day by day as calculated above, they are likely to spend more days researching their itineraries.
3:Issues specific to travel in Japan
Most foreigners who are not fluent in Japanese face the barrier of the Japanese language when traveling to Japan. As a result, they tend to concentrate in large cities where there are many foreign-language displays and travel information and where convenience is high.
In fact, in 2019, the top five prefectures will account for 70% of foreign travelers’ places of stay in the 47 prefectures. In contrast, the top five prefectures account for 35% of Japanese travelers’ places of stay, which is a big difference. It can be seen that foreigners with Japanese language barriers are concentrated in large cities and major tourist destinations, compared to Japanese who do not have the information barrier of the Japanese language and travel more freely in more places.

Share of foreign travelers in overnight stays by prefecture (2019).
Tokyo 22.1% Osaka 16.7% Kyoto 13.8% Hokkaido 8.9% Okinawa 8.9% Chiba 3.9% Kanagawa 2.4% Fukuoka 2.4% Yamanashi 2.4% Shizuoka 2.1% Gifu 1.8% Nagano 1.4% Aichi 1.4% Oita 1.2% Hyogo 0.9% Ishikawa 0.9% Kumamoto 0.7% Nara 0.7% Wakayama 0.7% Hiroshima 0.6% Nagasaki 0.6% Kagoshima 0.5% Kagawa 0.5% Niigata 0.4% Shiga 0.4% Iwate 0.3% Mie 0.3% Tochigi 0.3% Gunma 0.3% Miyazaki 0.3% Toyama 0.3% Aomori 0.2% Saga 0.2% Miyagi 0.2% Yamagata 0.2% Okayama 0.2% Fukushima 0.1% Tokushima 0.1% Ehime 0.1% Akita 0.1% Tottori 0.1% Shimane 0.1% Kochi 0.1% Yamaguchi 0.1% Fukui 0.1% Saitama 0.0% Ibaraki 0.0% Total 100.0%
Share of Japanese travelers in overnight stays by prefecture (2019).
Okinawa 9.1% Chiba 7.1% Hokkaido 6.7% Kyoto 6.3% Tokyo 6.0% Shizuoka 5.0% Nagano 4.9% Osaka 4.8% Kanagawa 3.8% Hyogo 3.1% Tochigi 2.6% Gunma 2.4% Niigata 2.2% Yamanashi 2.1% Fukushima 2.1% Ishikawa 2.0% Mie 1.8% Fukuoka 1.7% Oita 1.6% Miyagi 1.5% Gifu 1.5% Aichi 1.5% Wakayama 1.5% Nagasaki 1.4% Kagoshima 1.3% Shiga 1.1% Yamagata 1.1% Kumamoto 1.1% Iwate 1.1% Hiroshima 1.0% Fukui 0.9% Nara 0.8% Kagawa 0.8% Okayama 0.7% Ibaraki 0.7% Tottori 0.7% Yamaguchi 0.6% Aomori 0.6% Toyama 0.6% Shimane 0.6% Miyazaki 0.6% Akita 0.6% Ehime 0.6% Kochi 0.5% Saga 0.5% Tokushima 0.4% Saitama 0.3% Total 100.0%
4:Changes in travel purpose
According to Booking.com’s 2023 Travel Predictions, 88% of travelers want “Nostalgic trips”, 80% want “Community-minded trips”, and 73% want to travel “Out of comfort zone”. There is a possibility and a trend for foreign visitors, who have tended to concentrate on big cities and major tourist attractions, to disperse to the countryside. The biggest challenge for the travel and tourism industry in Japan’s rural areas, which wants more foreign tourists to visit, is to improve the dissatisfaction foreign tourists have with the difficulty of getting information about the rural areas.
The most popular types of vacations and experiences in 2023
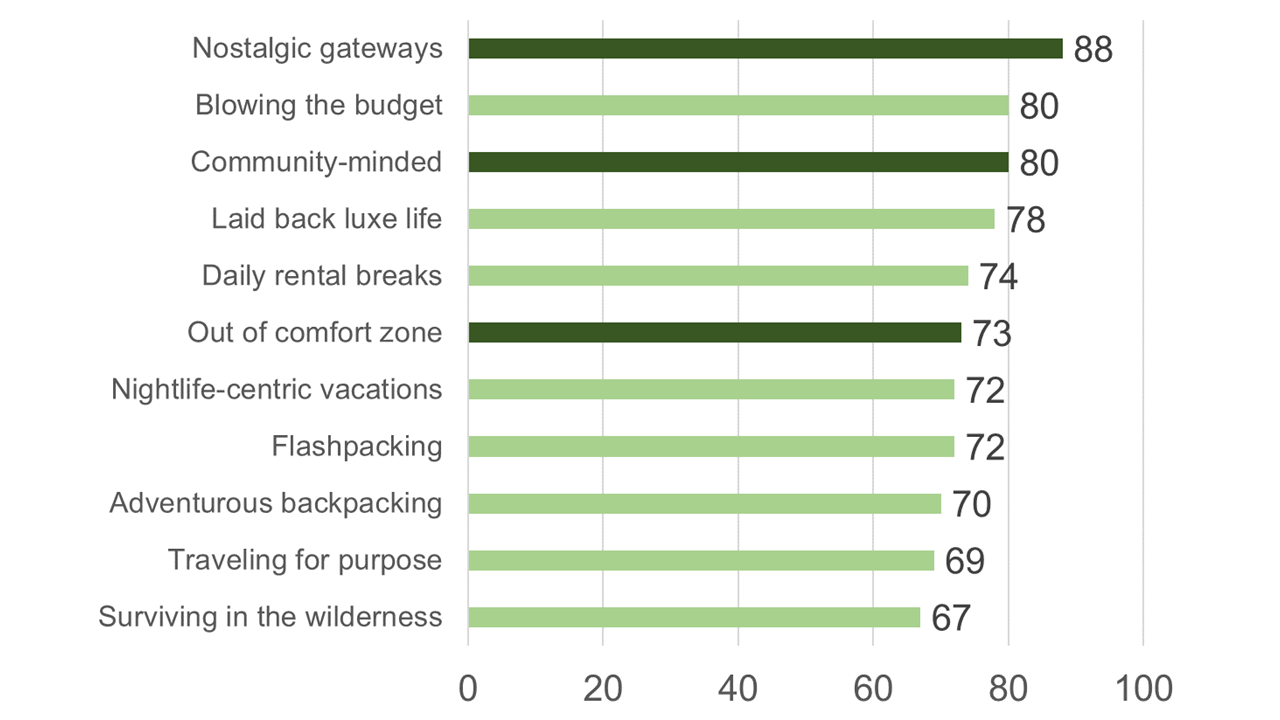
Source:Booking.com
Our company plans to provide travel information and itinerary creation free of charge to solve these travelers’ inconveniences. Foreign travelers planning a trip to Japan are encouraged to contact us via the “Registration / Inquiries“.