比較86種減低二氧化碳排放計畫,與搭乘飛機時不託運行李的減碳效果
目次
1:何謂「Project Drawdown反轉地球暖化計畫」?
2:比較每人每日平均排放二氧化碳的減碳效果
3:比較每人每年平均排放二氧化碳的減碳效果
1:何謂「Project Drawdown反轉地球暖化計畫」?
「Would you still bring your luggage on board a plane after looking at this data?」在先前主要使用了日本環境省的數據,比較了每人每日平均排放二氧化碳的減碳效果。這次則使用了「Project Drawdown反轉地球暖化計畫」的數據,針對各種減碳效果做了更多樣的比較。
在「Project Drawdown反轉地球暖化計畫」中,共集結190位研究員、專家、科學家組成了國際性團體,針對氣候變遷議題,提出了在現今技術發展之下能夠實際執行且大膽的解決方案,出版了「Drawdown: The Most Comprehensive Plan Ever Proposed to Reverse Global Warming」一書。這本著作透過領導世界的科學家及決策者們縝密的調查,提出了涵蓋2020年至2050年的解決方案,並在全世界中獲得高度評價。
「Project Drawdown」的最新數據可以在「https://drawdown.org」中看到。而我們利用了最新數據,以到日本旅行時不託運20公斤行李來減低二氧化碳排放量,這樣的減碳效果,比較書中提出的各種氣候變遷對策。我們使用的數據為Scenario 1,Scenario 1是至2100年為止將氣溫上升控制於2度的方案,另外,「Project Drawdown」將氣溫上升控制於1.5度的方案標註為Scenario 2。
Reduction in CO2 emissions(Drawdown Scenario 1 and 2)
SOLUTION SECTOR(S) SCENARIO 1 SCENARIO 2 Gigatons CO2 Equivalent Reduced / Sequestered (2020–2050) 1 Reduced Food Waste Food, Agriculture, and Land Use / Land Sinks 88.5 102.2 2 Plant-Rich Diets Food, Agriculture, and Land Use / Land Sinks 78.3 103.1 3 Family Planning and Education Health and Education 68.9 68.9 4 Refrigerant Management Industry / Buildings 57.2 57.2 5 Tropical Forest Restoration Land Sinks 54.5 85.1 6 Onshore Wind Turbines Electricity 47.0 143.6 7 Alternative Refrigerants Industry / Buildings 42.7 48.8 8 Utility-Scale Solar Photovoltaics Electricity 40.8 111.6 9 Clean Cooking Buildings 31.4 76.3 10 Distributed Solar Photovoltaics Electricity 26.7 64.9 11 Silvopasture Land Sinks 26.6 42.3 12 Methane Leak Management Other Energy 25.8 31.3 13 Peatland Protection and Rewetting Food, Agriculture, and Land Use / Land Sinks 25.4 40.3 14 Tree Plantations (on Degraded Land) Land Sinks 22.0 35.1 15 Temperate Forest Restoration Land Sinks 19.4 27.9 16 Concentrated Solar Power Electricity 18.0 21.5 17 Perennial Staple Crops Land Sinks 16.3 32.9 18 Insulation Electricity / Buildings 15.4 18.5 19 Regenerative Annual Cropping Food, Agriculture, and Land Use / Land Sinks 15.1 23.2 20 Tree Intercropping Land Sinks 15.0 24.4 21 LED Lighting Electricity 14.5 15.7 22 Managed Grazing Land Sinks 13.7 20.9 23 Multistrata Agroforestry Land Sinks 13.3 23.9 24 Conservation Agriculture Food, Agriculture, and Land Use / Land Sinks 12.8 8.1 25 Abandoned Farmland Restoration Land Sinks 12.5 20.3 26 Recycling Industry 10.4 11.3 27 Offshore Wind Turbines Electricity 10.2 9.9 28 Improved Rice Production Food, Agriculture, and Land Use / Land Sinks 9.9 14.4 29 Building Automation Systems Electricity / Buildings 9.6 14.0 30 Public Transit Transportation 9.4 15.4 31 Efficient Trucks Transportation 9.2 10.8 32 Carpooling Transportation 9.1 11.1 33 High-Performance Glass Electricity / Buildings 8.8 11.3 34 Indigenous Peoples’ Forest Tenure Food, Agriculture, and Land Use / Land Sinks 8.7 12.5 35 Bamboo Production Land Sinks 7.7 19.6 36 Alternative Cement Industry 7.7 15.6 37 Electric Cars Transportation 7.7 9.8 38 Smart Thermostats Electricity / Buildings 6.9 7.3 39 Efficient Ocean Shipping Transportation 6.7 9.8 40 Waste to Energy Electricity / Industry 6.3 5.2 41 District Heating Electricity / Buildings 6.2 9.7 42 Geothermal Power Electricity 6.2 9.2 43 Methane Digesters Electricity / Industry 6.0 7.1 44 Forest Protection Food, Agriculture, and Land Use / Land Sinks 5.6 8.8 45 Efficient Aviation Transportation 5.3 5.8 46 Biogas for Cooking Buildings 4.7 9.7 47 Improved Cattle Feed Food, Agriculture, and Land Use 4.4 15.1 48 Recycled Metals Industry 4.3 12.3 49 High-Efficiency Heat Pumps Electricity / Buildings 4.0 9.1 50 Perennial Biomass Production Land Sinks 4.0 7.0 51 Seafloor Protection Food, Agriculture, and Land Use 3.8 5.1 52 Reduced Plastics Industry 3.8 5.4 53 Solar Hot Water Electricity / Buildings 3.4 13.7 54 Grassland Protection Food, Agriculture, and Land Use / Land Sinks 3.4 4.3 55 Improved Manure Management Food, Agriculture, and Land Use 3.3 6.1 56 Nuclear Power Electricity 3.2 3.6 57 System of Rice Intensification Food, Agriculture, and Land Use / Land Sinks 2.9 4.4 58 Walkable Cities Transportation 2.8 3.5 59 Nutrient Management Food, Agriculture, and Land Use 2.8 11.5 60 Bicycle Infrastructure Transportation 2.7 4.6 61 Telepresence Transportation 2.6 4.4 62 Biomass Power Electricity 2.6 3.6 63 Macroalgae Protection and Restoration Coastal and Ocean Sinks 2.6 3.8 64 Seaweed Farming Coastal and Ocean Sinks / Coastal and Ocean Sinks 2.5 4.7 65 Recycled Paper Industry 2.3 2.9 66 Electric Trains Transportation 1.9 3.3 67 Small Hydropower Electricity 1.7 3.2 68 Hybrid Cars Transportation 1.6 4.7 69 Electric Bicycles Transportation 1.4 1.6 70 Biochar Production Engineered Sinks 1.4 3.0 71 Sustainable Intensification for Smallholders Food, Agriculture, and Land Use / Land Sinks 1.4 0.7 72 Bioplastics Industry 1.3 2.5 73 Ocean Power Electricity 1.3 0.8 74 High-Speed Rail Transportation 1.3 3.6 75 Coastal Wetland Protection Food, Agriculture, and Land Use / Coastal and Ocean Sinks 1.2 1.6 76 Farm Irrigation Efficiency Food, Agriculture, and Land Use 1.1 2.1 77 Composting Industry 1.1 1.4 78 Improved Fisheries Food, Agriculture, and Land Use / Coastal and Ocean Sinks 1.0 1.5 79 Low-Flow Fixtures Electricity / Buildings 0.9 1.5 80 Coastal Wetland Restoration Coastal and Ocean Sinks 0.8 1.0 81 Water Distribution Efficiency Electricity 0.6 0.9 82 Green and Cool Roofs Electricity / Buildings 0.5 1.0 83 Recycled Plastics Industry 0.5 1.7 84 Improved Aquaculture Food, Agriculture, and Land Use 0.5 0.8 85 Dynamic Glass Electricity / Buildings 0.3 0.5 86 Micro Wind Turbines Electricity 0.1 0.1 Total 1,047.0 1,638.7
Source: Project Drawdown

2:比較每人每日平均排放二氧化碳的減碳效果
「Project Drawdown」在計算每人平均二氧化碳排出量的減碳效果時,使用了2020年當時的世界人口數量(78.2億人)、經濟合作暨發展組織(OECD)會員國的人口數量(13.7億人)、高所得國家的人口數量(12.4億人),這三個數據。之所以會使用經濟合作暨發展組織(OECD)及高所得國家的人口數量來做計算,是由於考慮到全世界的二氧化碳排放量中,先進國家的二氧化碳排放量在整體裡佔更高比例,因此先進國家也有更大幅的減碳空間。順帶一提,2019年時全世界的二氧化碳排放量佔比,其中經濟合作暨發展組織(OECD)會員國佔了34%,而從高所得國家來看則是佔了35%。
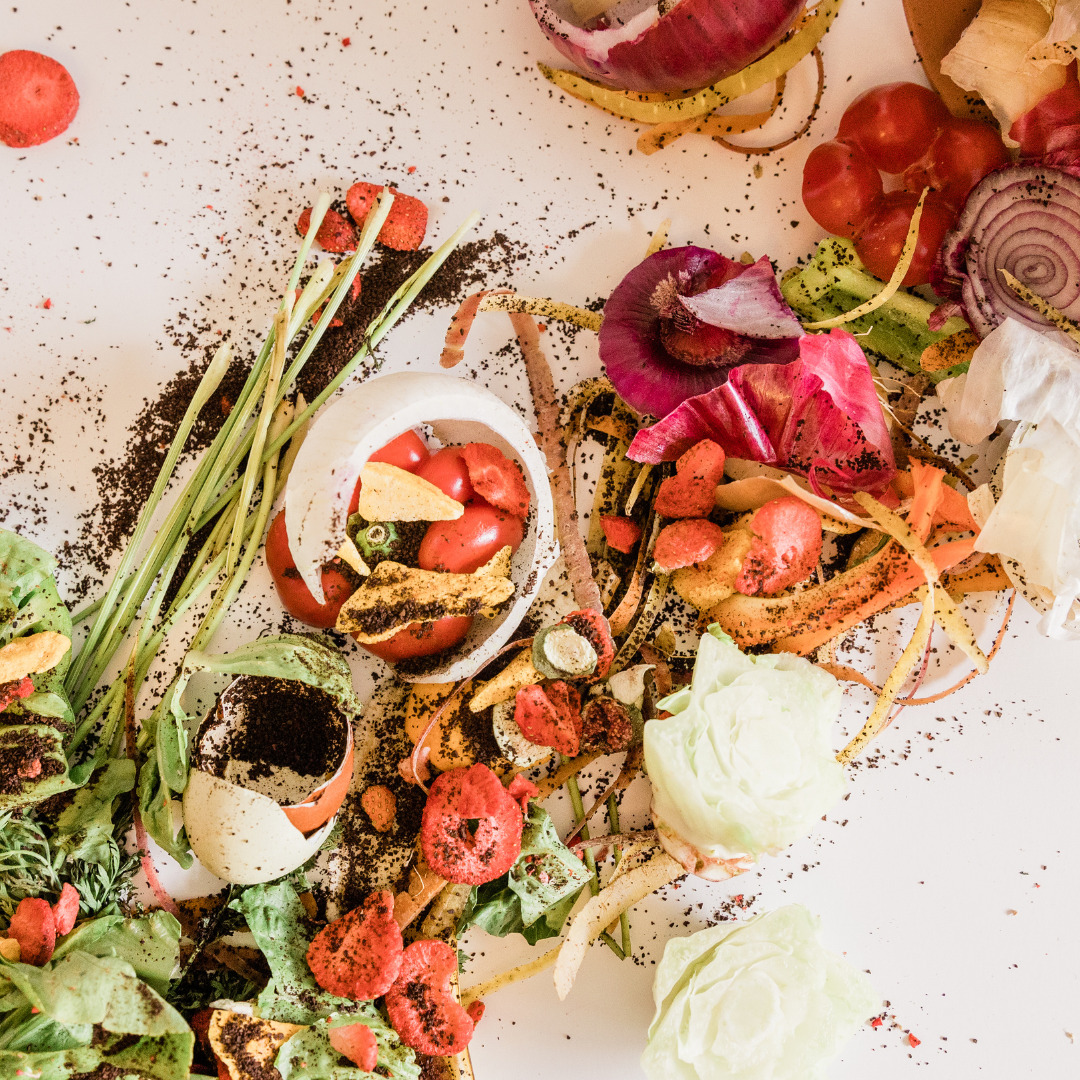
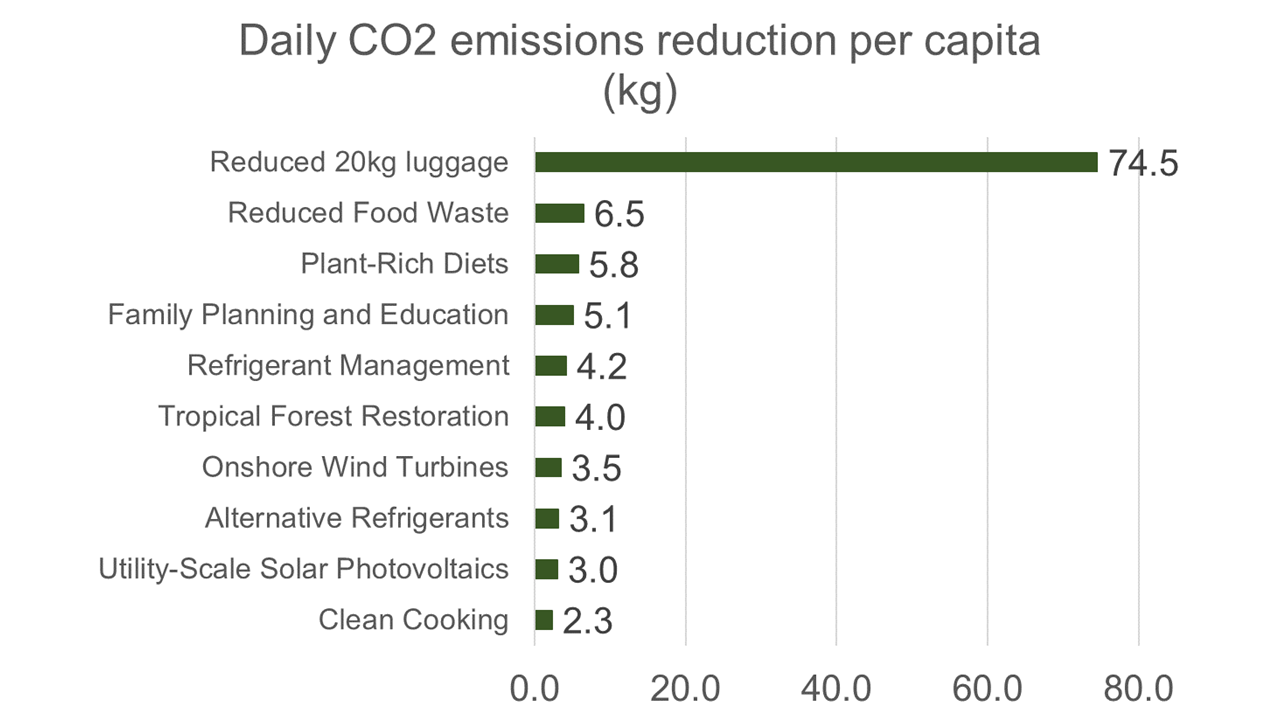
在「Project Drawdown」記載的86種降低二氧化碳計畫(Scenario 1之數據)中,以每人每日平均的減碳量來計算的話,擁有最高減碳效果的做法是「減少食物浪費」,其次則為「在飲食中多攝取植物性食品」。「減少食物浪費」所提出的每日平均減碳效果為,世界人口每人平均減碳1.0公斤、經濟合作暨發展組織(OECD)會員國每人平均減碳5.9公斤,高所得國家每人平均減碳6.5公斤。
如同「看過這些數據後你還會決定攜帶行李上飛機嗎?」的分析,搭乘飛機到日本旅行時不託運20公斤行李的話,便有減低74.5公斤二氧化碳排出量的效果(全世界19國搭機訪日之單程平均值),也就是說,若比較在「Project Drawdown」中記載的數據,不託運行李擁有10倍以上的二氧化碳減碳效果。
Daily CO2 emissions reduction per capita (kg)
SOLUTION World population OECD poluration High income population Reduced 20kg luggage (One way to Japan) 74.50 74.50 74.50 Reduced Food Waste 1.03 5.90 6.51 Plant-Rich Diets 0.91 5.22 5.76 Family Planning and Education 0.80 4.59 5.07 Refrigerant Management 0.67 3.81 4.21 Tropical Forest Restoration 0.64 3.63 4.01 Onshore Wind Turbines 0.55 3.13 3.46 Alternative Refrigerants 0.50 2.85 3.14 Utility-Scale Solar Photovoltaics 0.48 2.72 3.00 Clean Cooking 0.37 2.09 2.31 Distributed Solar Photovoltaics 0.31 1.78 1.96 Silvopasture 0.31 1.77 1.96 Methane Leak Management 0.30 1.72 1.90 Peatland Protection and Rewetting 0.30 1.69 1.87 Tree Plantations (on Degraded Land) 0.26 1.47 1.62 Temperate Forest Restoration 0.23 1.29 1.43 Concentrated Solar Power 0.21 1.20 1.32 Perennial Staple Crops 0.19 1.09 1.20 Insulation 0.18 1.03 1.13 Regenerative Annual Cropping 0.18 1.01 1.11 Tree Intercropping 0.18 1.00 1.11 LED Lighting 0.17 0.96 1.06 Managed Grazing 0.16 0.91 1.01 Multistrata Agroforestry 0.15 0.88 0.98 Conservation Agriculture 0.15 0.85 0.94 Abandoned Farmland Restoration 0.15 0.83 0.92 Recycling 0.12 0.69 0.76 Offshore Wind Turbines 0.12 0.68 0.75 Improved Rice Production 0.12 0.66 0.72 Building Automation Systems 0.11 0.64 0.70 Public Transit 0.11 0.63 0.69 Efficient Trucks 0.11 0.61 0.67 Carpooling 0.11 0.60 0.67 High-Performance Glass 0.10 0.59 0.65 Indigenous Peoples’ Forest Tenure 0.10 0.58 0.64 Bamboo Production 0.09 0.51 0.57 Alternative Cement 0.09 0.51 0.57 Electric Cars 0.09 0.51 0.56 Smart Thermostats 0.08 0.46 0.51 Efficient Ocean Shipping 0.08 0.45 0.49 Waste to Energy 0.07 0.42 0.46 District Heating 0.07 0.41 0.45 Geothermal Power 0.07 0.41 0.45 Methane Digesters 0.07 0.40 0.44 Forest Protection 0.06 0.37 0.41 Efficient Aviation 0.06 0.35 0.39 Biogas for Cooking 0.05 0.31 0.34 Improved Cattle Feed 0.05 0.29 0.33 Recycled Metals 0.05 0.29 0.32 High-Efficiency Heat Pumps 0.05 0.27 0.30 Perennial Biomass Production 0.05 0.27 0.29 Seafloor Protection 0.04 0.25 0.28 Reduced Plastics 0.04 0.25 0.28 Solar Hot Water 0.04 0.23 0.25 Grassland Protection 0.04 0.22 0.25 Improved Manure Management 0.04 0.22 0.25 Nuclear Power 0.04 0.21 0.23 System of Rice Intensification 0.03 0.19 0.21 Walkable Cities 0.03 0.19 0.21 Nutrient Management 0.03 0.18 0.20 Bicycle Infrastructure 0.03 0.18 0.20 Telepresence 0.03 0.18 0.19 Biomass Power 0.03 0.17 0.19 Macroalgae Protection and Restoration 0.03 0.17 0.19 Seaweed Farming 0.03 0.17 0.18 Recycled Paper 0.03 0.15 0.17 Electric Trains 0.02 0.13 0.14 Small Hydropower 0.02 0.11 0.12 Hybrid Cars 0.02 0.11 0.12 Electric Bicycles 0.02 0.09 0.10 Biochar Production 0.02 0.09 0.10 Sustainable Intensification for Smallholders 0.02 0.09 0.10 Bioplastics 0.02 0.09 0.10 Ocean Power 0.01 0.08 0.09 High-Speed Rail 0.01 0.08 0.09 Coastal Wetland Protection 0.01 0.08 0.09 Farm Irrigation Efficiency 0.01 0.08 0.08 Composting 0.01 0.08 0.08 Improved Fisheries 0.01 0.07 0.07 Low-Flow Fixtures 0.01 0.06 0.07 Coastal Wetland Restoration 0.01 0.05 0.06 Water Distribution Efficiency 0.01 0.04 0.04 Green and Cool Roofs 0.01 0.04 0.04 Recycled Plastics 0.01 0.03 0.04 Improved Aquaculture 0.01 0.03 0.04 Dynamic Glass 0.004 0.02 0.03 Micro Wind Turbines 0.001 0.01 0.01
Source: Project Drawdown, Japan Tourism Agency, Worldometer, World Bank Data, ECTA, and our calculations
Note: Calculations based on Scenario 1 of Project Drawdown
Source: Project Drawdown, Japan Tourism Agency, Worldometer, World Bank Data, ECTA, and our calculations
Note: Per capita reduction is calculated based on the population of Scenario 1, High-income countries in Project Drawdown. “Reduced 20kg luggage” is the reduction in CO2 emissions when 20kg of luggage is not carried on board an airplane for travel to Japan (the average one-way trip from 19 countries).
3:比較每人每年平均排放二氧化碳的減碳效果
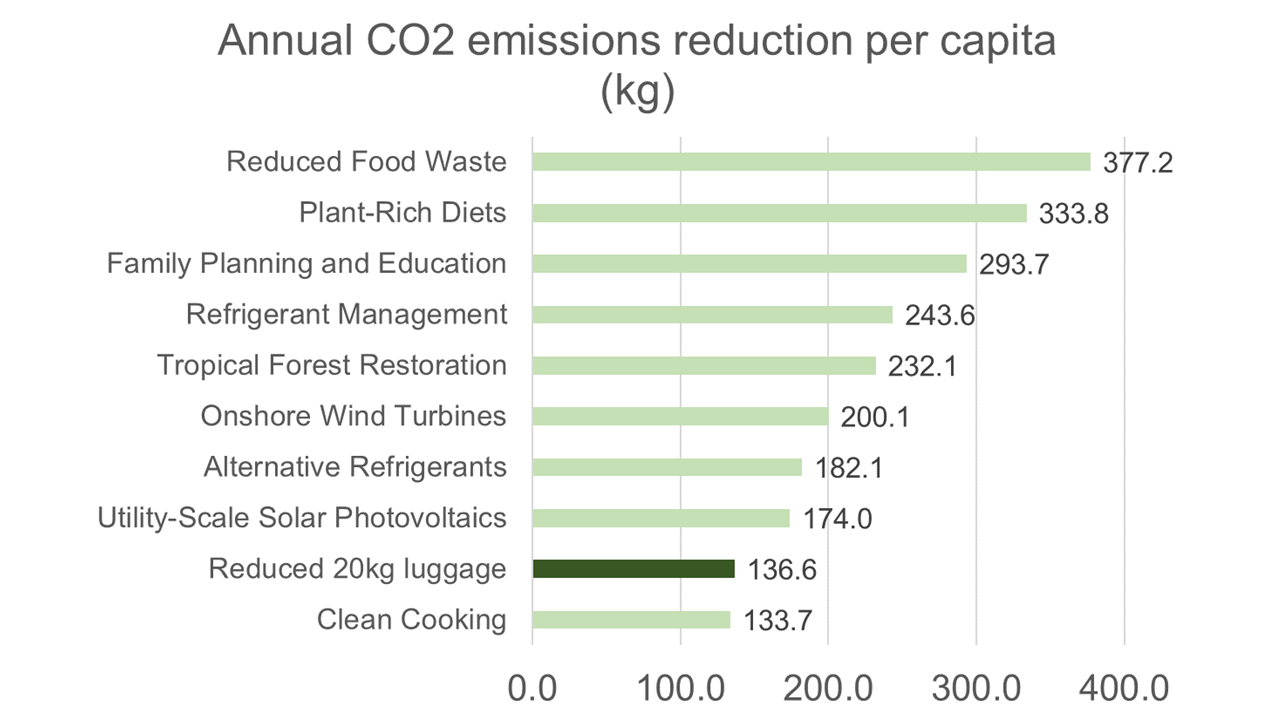
根據日本觀光廳的「訪日外國人消費動向(2019年)」報告指出,外國人平均一年訪日次數為1.8次,以全世界19國搭機訪日的飛行距離・訪日人數・平均一年訪日次數來計算的話,若在搭飛機時不託運20公斤的行李,便可以得到一年總計減低137公斤二氧化碳排放量的效果(以一年平均訪日1.8次計算)。
Annual CO2 emissions reduction per capita (kg)
SOLUTION World population OECD poluration High income population 1 Reduced Food Waste 377.2 2,152.9 2,377.3 2 Plant-Rich Diets 333.8 1,905.5 2,104.1 3 Family Planning and Education 293.7 1,676.1 1,850.8 4 Refrigerant Management 243.6 1,390.3 1,535.2 5 Tropical Forest Restoration 232.1 1,324.6 1,462.6 6 Onshore Wind Turbines 200.1 1,142.1 1,261.2 7 Alternative Refrigerants 182.1 1,039.5 1,147.8 8 Utility-Scale Solar Photovoltaics 174.0 993.3 1,096.8 Reduced 20kg luggage (1.8 round-trip to Japan) 136.6 9 Clean Cooking 133.7 763.4 842.9 10 Distributed Solar Photovoltaics 113.6 648.3 715.9 11 Silvopasture 113.3 646.6 714.0 12 Methane Leak Management 110.1 628.4 693.9 13 Peatland Protection and Rewetting 108.3 617.9 682.3 14 Tree Plantations (on Degraded Land) 93.9 536.2 592.0 15 Temperate Forest Restoration 82.8 472.4 521.7 16 Concentrated Solar Power 76.7 437.9 483.5 17 Perennial Staple Crops 69.6 397.5 438.9 18 Insulation 65.6 374.1 413.1 19 Regenerative Annual Cropping 64.4 367.8 406.2 20 Tree Intercropping 64.1 365.6 403.7 21 LED Lighting 61.6 351.5 388.2 22 Managed Grazing 58.5 333.8 368.5 23 Multistrata Agroforestry 56.5 322.6 356.2 24 Conservation Agriculture 54.6 311.6 344.1 25 Abandoned Farmland Restoration 53.2 303.6 335.2 26 Recycling 44.2 252.0 278.3 27 Offshore Wind Turbines 43.6 248.6 274.5 28 Improved Rice Production 42.0 239.6 264.6 29 Building Automation Systems 40.7 232.3 256.5 30 Public Transit 40.1 229.2 253.0 31 Efficient Trucks 39.0 222.6 245.8 32 Carpooling 38.6 220.4 243.4 33 High-Performance Glass 37.6 214.6 236.9 34 Indigenous Peoples’ Forest Tenure 37.0 211.4 233.4 35 Bamboo Production 32.8 187.3 206.8 36 Alternative Cement 32.8 187.3 206.8 37 Electric Cars 32.6 186.3 205.8 38 Smart Thermostats 29.5 168.1 185.6 39 Efficient Ocean Shipping 28.6 163.5 180.5 40 Waste to Energy 26.7 152.5 168.4 41 District Heating 26.3 150.3 166.0 42 Geothermal Power 26.2 149.6 165.2 43 Methane Digesters 25.7 146.4 161.7 Reduced 20kg luggage (1.8 round-trip to Japan) 136.6 44 Forest Protection 23.7 135.0 149.1 45 Efficient Aviation 22.5 128.7 142.1 Reduced 20kg luggage (1.8 round-trip to Japan) 136.6 46 Biogas for Cooking 19.8 113.1 124.9 47 Improved Cattle Feed 18.8 107.5 118.7 48 Recycled Metals 18.4 104.8 115.8 49 High-Efficiency Heat Pumps 17.2 98.3 108.5 50 Perennial Biomass Production 17.0 97.3 107.4 51 Seafloor Protection 16.2 92.4 102.1 52 Reduced Plastics 16.0 91.5 101.0 53 Solar Hot Water 14.5 83.0 91.6 54 Grassland Protection 14.3 81.5 90.0 55 Improved Manure Management 14.2 81.3 89.7 56 Nuclear Power 13.5 77.1 85.2 57 System of Rice Intensification 12.4 70.5 77.9 58 Walkable Cities 12.1 68.8 76.0 59 Nutrient Management 11.8 67.4 74.4 60 Bicycle Infrastructure 11.6 66.4 73.3 61 Telepresence 11.3 64.2 70.9 62 Biomass Power 11.2 63.7 70.4 63 Macroalgae Protection and Restoration 11.1 63.5 70.1 64 Seaweed Farming 10.7 60.8 67.2 65 Recycled Paper 9.7 55.5 61.2 66 Electric Trains 8.1 46.5 51.3 67 Small Hydropower 7.0 40.1 44.3 68 Hybrid Cars 6.9 39.2 43.2 69 Electric Bicycles 5.9 33.8 37.3 70 Biochar Production 5.8 33.1 36.5 71 Sustainable Intensification for Smallholders 5.8 33.1 36.5 72 Bioplastics 5.7 32.4 35.7 73 Ocean Power 5.4 30.9 34.1 74 High-Speed Rail 5.4 30.7 33.8 75 Coastal Wetland Protection 5.1 29.2 32.2 76 Farm Irrigation Efficiency 4.8 27.5 30.4 77 Composting 4.8 27.5 30.4 78 Improved Fisheries 4.3 24.6 27.1 79 Low-Flow Fixtures 4.0 22.6 25.0 80 Coastal Wetland Restoration 3.2 18.5 20.4 81 Water Distribution Efficiency 2.6 14.8 16.4 82 Green and Cool Roofs 2.3 12.9 14.2 83 Recycled Plastics 2.2 12.6 14.0 84 Improved Aquaculture 2.1 12.2 13.4 85 Dynamic Glass 1.4 8.3 9.1 86 Micro Wind Turbines 0.4 2.2 2.4
Source: Project Drawdown, Japan Tourism Agency, Worldometer, World Bank Data, ECTA, and our calculations
Note: Calculations based on Scenario 1 of Project Drawdown
Note: CO2 emissions reductions per capita are calculated based on Scenario 1 of Project Drawdown and the world population. “Reduced 20kg luggage” is the CO2 emissions reduction effect of stopping loading 20kg of luggage on airplanes when traveling to Japan (one-way average from 19 countries).
若將減碳137公斤的效果,與「Project Drawdown」所提出的86種降低二氧化碳排放量計畫相比,在世界人口平均減碳效果中排名第9名,經濟合作暨發展組織(OECD)會員國中的減碳效果中排行第44名,高所得國家的減碳效果中則排行第46名,這在全世界科學家嚴選出來的「反轉地球暖化100招」中算是非常靠前的排名,我想這證明了只要在搭乘飛機時減量行李,便能夠達成非常大的減碳效果。
「Project Drawdown」在解決方案中,提出了從現在起至2050年為止能夠實踐的減碳方法,因此有些方法在目前技術上尚未發開完成,而搭乘飛機時減量行李則是此刻就可以立即實踐的方式。搭飛機時不攜帶行李,更可以省去旅行前準備行李、旅途中搬運行李、旅遊後清洗及整理衣物所需花費的時間及精力,並且讓高齡者及身心障礙人士、親子旅行等較不方便移動的族群,能更輕易地出遊,進而解決旅行落差的問題。立即來體驗看看這種為我們、為地球帶來多種好處,不攜帶行李的新型態旅行吧!