Comparison of 87 CO2 reduction projects
Table of Contents
1:What is “Project Drawdown”?
2:Comparison of reductions in CO2 emissions per person per day
3:Comparison of CO2 emission reductions per person per year
1:What is “Project Drawdown”?
We mainly used data from Japan’s Ministry of the Environment on “Would you still bring your luggage on board a plane after looking at this data?” to compare CO2 emission reductions per person per day. This time, we will use data from “Project Drawdown” to compare with more CO2 emission reduction projects.
“Project Drawdown” brought together an international group of 190 researchers, experts, and scientists to compile realistic and bold solutions to climate change. The results were collected and published in the book Drawdown: The Most Comprehensive Plan Ever Proposed to Reverse Global Warming. Based on in-depth research by the world’s leading scientists and policymakers, the book is highly acclaimed around the world as a comprehensive set of solutions for the years 2020-2050.
We can find the latest data at “Project Drawdown(https://drawdown.org)“. We used this latest data to compare the CO2 emission reductions that could be achieved by stopping the use of 20 kg of luggage on airplanes when traveling to Japan with each of the climate change measures proposed in the book. The data we used is from Scenario 1, a scenario that limits the temperature increase to 2 degrees Celsius by 2100. The Project Drawdown also includes Scenario 2, which limits temperature increase to 1.5 degrees Celsius.
Reduction in CO2 emissions(Drawdown Scenario 1 and 2)
SOLUTION SECTOR(S) SCENARIO 1 SCENARIO 2 Gigatons CO2 Equivalent Reduced / Sequestered (2020–2050) 1 Reduced Food Waste Food, Agriculture, and Land Use / Land Sinks 88.5 102.2 2 Plant-Rich Diets Food, Agriculture, and Land Use / Land Sinks 78.3 103.1 3 Family Planning and Education Health and Education 68.9 68.9 4 Refrigerant Management Industry / Buildings 57.2 57.2 5 Tropical Forest Restoration Land Sinks 54.5 85.1 6 Onshore Wind Turbines Electricity 47.0 143.6 7 Alternative Refrigerants Industry / Buildings 42.7 48.8 8 Utility-Scale Solar Photovoltaics Electricity 40.8 111.6 9 Clean Cooking Buildings 31.4 76.3 10 Distributed Solar Photovoltaics Electricity 26.7 64.9 11 Silvopasture Land Sinks 26.6 42.3 12 Methane Leak Management Other Energy 25.8 31.3 13 Peatland Protection and Rewetting Food, Agriculture, and Land Use / Land Sinks 25.4 40.3 14 Tree Plantations (on Degraded Land) Land Sinks 22.0 35.1 15 Temperate Forest Restoration Land Sinks 19.4 27.9 16 Concentrated Solar Power Electricity 18.0 21.5 17 Perennial Staple Crops Land Sinks 16.3 32.9 18 Insulation Electricity / Buildings 15.4 18.5 19 Regenerative Annual Cropping Food, Agriculture, and Land Use / Land Sinks 15.1 23.2 20 Tree Intercropping Land Sinks 15.0 24.4 21 LED Lighting Electricity 14.5 15.7 22 Managed Grazing Land Sinks 13.7 20.9 23 Multistrata Agroforestry Land Sinks 13.3 23.9 24 Conservation Agriculture Food, Agriculture, and Land Use / Land Sinks 12.8 8.1 25 Abandoned Farmland Restoration Land Sinks 12.5 20.3 26 Recycling Industry 10.4 11.3 27 Offshore Wind Turbines Electricity 10.2 9.9 28 Improved Rice Production Food, Agriculture, and Land Use / Land Sinks 9.9 14.4 29 Building Automation Systems Electricity / Buildings 9.6 14.0 30 Public Transit Transportation 9.4 15.4 31 Efficient Trucks Transportation 9.2 10.8 32 Carpooling Transportation 9.1 11.1 33 High-Performance Glass Electricity / Buildings 8.8 11.3 34 Indigenous Peoples’ Forest Tenure Food, Agriculture, and Land Use / Land Sinks 8.7 12.5 35 Bamboo Production Land Sinks 7.7 19.6 36 Alternative Cement Industry 7.7 15.6 37 Electric Cars Transportation 7.7 9.8 38 Smart Thermostats Electricity / Buildings 6.9 7.3 39 Efficient Ocean Shipping Transportation 6.7 9.8 40 Waste to Energy Electricity / Industry 6.3 5.2 41 District Heating Electricity / Buildings 6.2 9.7 42 Geothermal Power Electricity 6.2 9.2 43 Methane Digesters Electricity / Industry 6.0 7.1 44 Forest Protection Food, Agriculture, and Land Use / Land Sinks 5.6 8.8 45 Efficient Aviation Transportation 5.3 5.8 46 Biogas for Cooking Buildings 4.7 9.7 47 Improved Cattle Feed Food, Agriculture, and Land Use 4.4 15.1 48 Recycled Metals Industry 4.3 12.3 49 High-Efficiency Heat Pumps Electricity / Buildings 4.0 9.1 50 Perennial Biomass Production Land Sinks 4.0 7.0 51 Seafloor Protection Food, Agriculture, and Land Use 3.8 5.1 52 Reduced Plastics Industry 3.8 5.4 53 Solar Hot Water Electricity / Buildings 3.4 13.7 54 Grassland Protection Food, Agriculture, and Land Use / Land Sinks 3.4 4.3 55 Improved Manure Management Food, Agriculture, and Land Use 3.3 6.1 56 Nuclear Power Electricity 3.2 3.6 57 System of Rice Intensification Food, Agriculture, and Land Use / Land Sinks 2.9 4.4 58 Walkable Cities Transportation 2.8 3.5 59 Nutrient Management Food, Agriculture, and Land Use 2.8 11.5 60 Bicycle Infrastructure Transportation 2.7 4.6 61 Telepresence Transportation 2.6 4.4 62 Biomass Power Electricity 2.6 3.6 63 Macroalgae Protection and Restoration Coastal and Ocean Sinks 2.6 3.8 64 Seaweed Farming Coastal and Ocean Sinks / Coastal and Ocean Sinks 2.5 4.7 65 Recycled Paper Industry 2.3 2.9 66 Electric Trains Transportation 1.9 3.3 67 Small Hydropower Electricity 1.7 3.2 68 Hybrid Cars Transportation 1.6 4.7 69 Electric Bicycles Transportation 1.4 1.6 70 Biochar Production Engineered Sinks 1.4 3.0 71 Sustainable Intensification for Smallholders Food, Agriculture, and Land Use / Land Sinks 1.4 0.7 72 Bioplastics Industry 1.3 2.5 73 Ocean Power Electricity 1.3 0.8 74 High-Speed Rail Transportation 1.3 3.6 75 Coastal Wetland Protection Food, Agriculture, and Land Use / Coastal and Ocean Sinks 1.2 1.6 76 Farm Irrigation Efficiency Food, Agriculture, and Land Use 1.1 2.1 77 Composting Industry 1.1 1.4 78 Improved Fisheries Food, Agriculture, and Land Use / Coastal and Ocean Sinks 1.0 1.5 79 Low-Flow Fixtures Electricity / Buildings 0.9 1.5 80 Coastal Wetland Restoration Coastal and Ocean Sinks 0.8 1.0 81 Water Distribution Efficiency Electricity 0.6 0.9 82 Green and Cool Roofs Electricity / Buildings 0.5 1.0 83 Recycled Plastics Industry 0.5 1.7 84 Improved Aquaculture Food, Agriculture, and Land Use 0.5 0.8 85 Dynamic Glass Electricity / Buildings 0.3 0.5 86 Micro Wind Turbines Electricity 0.1 0.1 Total 1,047.0 1,638.7
Source: Project Drawdown

2:Comparison of reductions in CO2 emissions per person per day
In calculating the per capita CO2 emission reductions in Project Drawdown, we used the world population as of 2020 (7.82 billion), the OECD population (1.37 billion), and the population of high-income countries (1.24 billion). income country populations were used because developed countries have more CO2 emissions than developed countries and therefore have more room to reduce their CO2 emissions. Note that in 2019 data, the OECD accounts for 34% of global CO2 emissions, and High-income countries account for 35%.
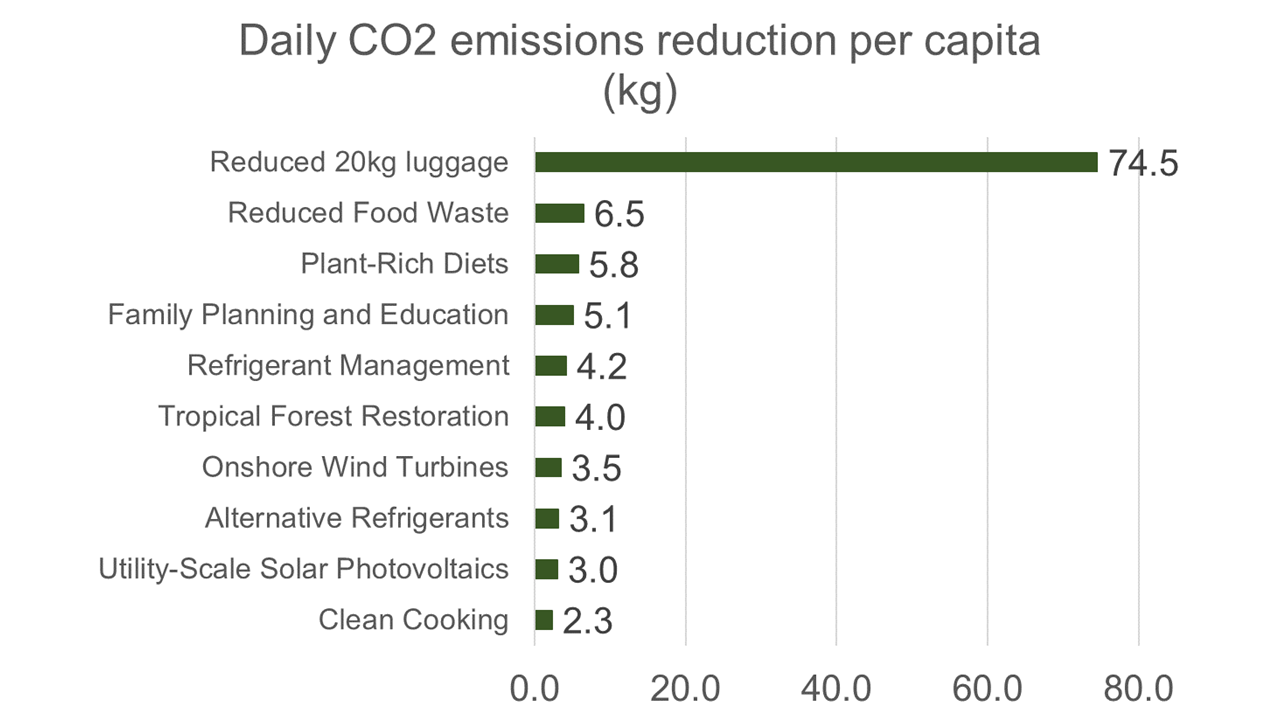
The largest CO2 reduction per person per day is in Reduced Food Waste, the second largest is in Plant-Rich Diets by calculating the 86 CO2 reduction projects listed in the Project Drawdown (data from Scenario 1). The reduction in daily CO2 emissions from “Reduced Food Waste” is 1.0 kg per capita for the global population, 5.9 kg per capita for the OECD population, and 6.5 kg per capita for the population of high-income countries.
As we analyzed in “Would you still bring your luggage on board a plane after looking at this data?“, the CO2 emission reduction (one-way average from 19 countries) of not carrying 20 kg of luggage on airplanes when traveling to Japan is 74.5 kg. This 74.5 kg is more than 10 times more effective than any CO2 emission reduction effect listed in “Project Drawdown”.
Daily CO2 emissions reduction per capita (kg)
SOLUTION World population OECD poluration High income population Reduced 20kg luggage (One way to Japan) 74.50 74.50 74.50 Reduced Food Waste 1.03 5.90 6.51 Plant-Rich Diets 0.91 5.22 5.76 Family Planning and Education 0.80 4.59 5.07 Refrigerant Management 0.67 3.81 4.21 Tropical Forest Restoration 0.64 3.63 4.01 Onshore Wind Turbines 0.55 3.13 3.46 Alternative Refrigerants 0.50 2.85 3.14 Utility-Scale Solar Photovoltaics 0.48 2.72 3.00 Clean Cooking 0.37 2.09 2.31 Distributed Solar Photovoltaics 0.31 1.78 1.96 Silvopasture 0.31 1.77 1.96 Methane Leak Management 0.30 1.72 1.90 Peatland Protection and Rewetting 0.30 1.69 1.87 Tree Plantations (on Degraded Land) 0.26 1.47 1.62 Temperate Forest Restoration 0.23 1.29 1.43 Concentrated Solar Power 0.21 1.20 1.32 Perennial Staple Crops 0.19 1.09 1.20 Insulation 0.18 1.03 1.13 Regenerative Annual Cropping 0.18 1.01 1.11 Tree Intercropping 0.18 1.00 1.11 LED Lighting 0.17 0.96 1.06 Managed Grazing 0.16 0.91 1.01 Multistrata Agroforestry 0.15 0.88 0.98 Conservation Agriculture 0.15 0.85 0.94 Abandoned Farmland Restoration 0.15 0.83 0.92 Recycling 0.12 0.69 0.76 Offshore Wind Turbines 0.12 0.68 0.75 Improved Rice Production 0.12 0.66 0.72 Building Automation Systems 0.11 0.64 0.70 Public Transit 0.11 0.63 0.69 Efficient Trucks 0.11 0.61 0.67 Carpooling 0.11 0.60 0.67 High-Performance Glass 0.10 0.59 0.65 Indigenous Peoples’ Forest Tenure 0.10 0.58 0.64 Bamboo Production 0.09 0.51 0.57 Alternative Cement 0.09 0.51 0.57 Electric Cars 0.09 0.51 0.56 Smart Thermostats 0.08 0.46 0.51 Efficient Ocean Shipping 0.08 0.45 0.49 Waste to Energy 0.07 0.42 0.46 District Heating 0.07 0.41 0.45 Geothermal Power 0.07 0.41 0.45 Methane Digesters 0.07 0.40 0.44 Forest Protection 0.06 0.37 0.41 Efficient Aviation 0.06 0.35 0.39 Biogas for Cooking 0.05 0.31 0.34 Improved Cattle Feed 0.05 0.29 0.33 Recycled Metals 0.05 0.29 0.32 High-Efficiency Heat Pumps 0.05 0.27 0.30 Perennial Biomass Production 0.05 0.27 0.29 Seafloor Protection 0.04 0.25 0.28 Reduced Plastics 0.04 0.25 0.28 Solar Hot Water 0.04 0.23 0.25 Grassland Protection 0.04 0.22 0.25 Improved Manure Management 0.04 0.22 0.25 Nuclear Power 0.04 0.21 0.23 System of Rice Intensification 0.03 0.19 0.21 Walkable Cities 0.03 0.19 0.21 Nutrient Management 0.03 0.18 0.20 Bicycle Infrastructure 0.03 0.18 0.20 Telepresence 0.03 0.18 0.19 Biomass Power 0.03 0.17 0.19 Macroalgae Protection and Restoration 0.03 0.17 0.19 Seaweed Farming 0.03 0.17 0.18 Recycled Paper 0.03 0.15 0.17 Electric Trains 0.02 0.13 0.14 Small Hydropower 0.02 0.11 0.12 Hybrid Cars 0.02 0.11 0.12 Electric Bicycles 0.02 0.09 0.10 Biochar Production 0.02 0.09 0.10 Sustainable Intensification for Smallholders 0.02 0.09 0.10 Bioplastics 0.02 0.09 0.10 Ocean Power 0.01 0.08 0.09 High-Speed Rail 0.01 0.08 0.09 Coastal Wetland Protection 0.01 0.08 0.09 Farm Irrigation Efficiency 0.01 0.08 0.08 Composting 0.01 0.08 0.08 Improved Fisheries 0.01 0.07 0.07 Low-Flow Fixtures 0.01 0.06 0.07 Coastal Wetland Restoration 0.01 0.05 0.06 Water Distribution Efficiency 0.01 0.04 0.04 Green and Cool Roofs 0.01 0.04 0.04 Recycled Plastics 0.01 0.03 0.04 Improved Aquaculture 0.01 0.03 0.04 Dynamic Glass 0.004 0.02 0.03 Micro Wind Turbines 0.001 0.01 0.01
Source: Project Drawdown, Japan Tourism Agency, Worldometer, World Bank Data, ECTA, and our calculations
Note: Calculations based on Scenario 1 of Project Drawdown
Source: Project Drawdown, Japan Tourism Agency, Worldometer, World Bank Data, ECTA, and our calculations
Note: Per capita reduction is calculated based on the population of Scenario 1, High-income countries in Project Drawdown. “Reduced 20kg luggage” is the reduction in CO2 emissions when 20kg of luggage is not carried on board an airplane for travel to Japan (the average one-way trip from 19 countries).
3:Comparison of CO2 emission reductions per person per year
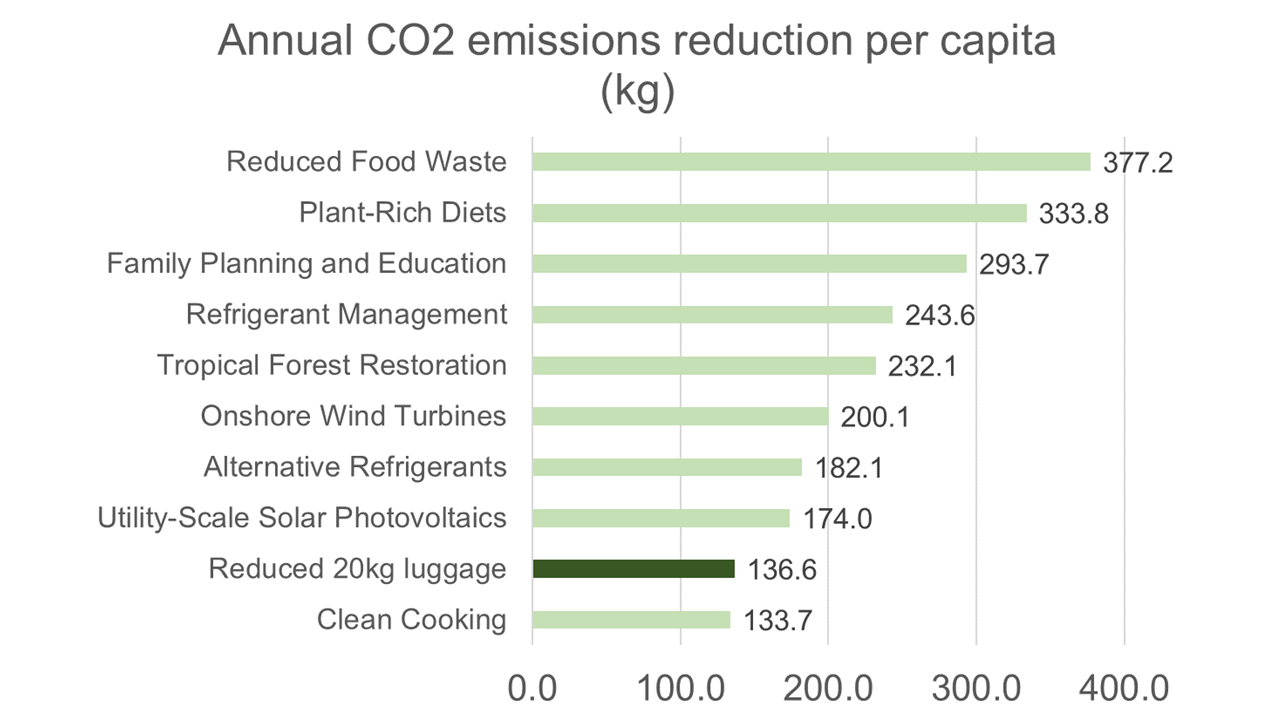
According to Japan’s Japan Tourism Agency’s “Consumption Trends of Foreign Visitors to Japan (2019),” foreigners visited Japan an average of 1.8 times per year. Based on the flight distance from 19 countries, the number of visitors to Japan, and the number of visits per year, the reduction in CO2 emissions per year (1.8 visits on average) resulting from one traveler not carrying 20 kg of luggage on board an airplane is 137 kg.
Annual CO2 emissions reduction per capita (kg)
SOLUTION World population OECD poluration High income population 1 Reduced Food Waste 377.2 2,152.9 2,377.3 2 Plant-Rich Diets 333.8 1,905.5 2,104.1 3 Family Planning and Education 293.7 1,676.1 1,850.8 4 Refrigerant Management 243.6 1,390.3 1,535.2 5 Tropical Forest Restoration 232.1 1,324.6 1,462.6 6 Onshore Wind Turbines 200.1 1,142.1 1,261.2 7 Alternative Refrigerants 182.1 1,039.5 1,147.8 8 Utility-Scale Solar Photovoltaics 174.0 993.3 1,096.8 Reduced 20kg luggage (1.8 round-trip to Japan) 136.6 9 Clean Cooking 133.7 763.4 842.9 10 Distributed Solar Photovoltaics 113.6 648.3 715.9 11 Silvopasture 113.3 646.6 714.0 12 Methane Leak Management 110.1 628.4 693.9 13 Peatland Protection and Rewetting 108.3 617.9 682.3 14 Tree Plantations (on Degraded Land) 93.9 536.2 592.0 15 Temperate Forest Restoration 82.8 472.4 521.7 16 Concentrated Solar Power 76.7 437.9 483.5 17 Perennial Staple Crops 69.6 397.5 438.9 18 Insulation 65.6 374.1 413.1 19 Regenerative Annual Cropping 64.4 367.8 406.2 20 Tree Intercropping 64.1 365.6 403.7 21 LED Lighting 61.6 351.5 388.2 22 Managed Grazing 58.5 333.8 368.5 23 Multistrata Agroforestry 56.5 322.6 356.2 24 Conservation Agriculture 54.6 311.6 344.1 25 Abandoned Farmland Restoration 53.2 303.6 335.2 26 Recycling 44.2 252.0 278.3 27 Offshore Wind Turbines 43.6 248.6 274.5 28 Improved Rice Production 42.0 239.6 264.6 29 Building Automation Systems 40.7 232.3 256.5 30 Public Transit 40.1 229.2 253.0 31 Efficient Trucks 39.0 222.6 245.8 32 Carpooling 38.6 220.4 243.4 33 High-Performance Glass 37.6 214.6 236.9 34 Indigenous Peoples’ Forest Tenure 37.0 211.4 233.4 35 Bamboo Production 32.8 187.3 206.8 36 Alternative Cement 32.8 187.3 206.8 37 Electric Cars 32.6 186.3 205.8 38 Smart Thermostats 29.5 168.1 185.6 39 Efficient Ocean Shipping 28.6 163.5 180.5 40 Waste to Energy 26.7 152.5 168.4 41 District Heating 26.3 150.3 166.0 42 Geothermal Power 26.2 149.6 165.2 43 Methane Digesters 25.7 146.4 161.7 Reduced 20kg luggage (1.8 round-trip to Japan) 136.6 44 Forest Protection 23.7 135.0 149.1 45 Efficient Aviation 22.5 128.7 142.1 Reduced 20kg luggage (1.8 round-trip to Japan) 136.6 46 Biogas for Cooking 19.8 113.1 124.9 47 Improved Cattle Feed 18.8 107.5 118.7 48 Recycled Metals 18.4 104.8 115.8 49 High-Efficiency Heat Pumps 17.2 98.3 108.5 50 Perennial Biomass Production 17.0 97.3 107.4 51 Seafloor Protection 16.2 92.4 102.1 52 Reduced Plastics 16.0 91.5 101.0 53 Solar Hot Water 14.5 83.0 91.6 54 Grassland Protection 14.3 81.5 90.0 55 Improved Manure Management 14.2 81.3 89.7 56 Nuclear Power 13.5 77.1 85.2 57 System of Rice Intensification 12.4 70.5 77.9 58 Walkable Cities 12.1 68.8 76.0 59 Nutrient Management 11.8 67.4 74.4 60 Bicycle Infrastructure 11.6 66.4 73.3 61 Telepresence 11.3 64.2 70.9 62 Biomass Power 11.2 63.7 70.4 63 Macroalgae Protection and Restoration 11.1 63.5 70.1 64 Seaweed Farming 10.7 60.8 67.2 65 Recycled Paper 9.7 55.5 61.2 66 Electric Trains 8.1 46.5 51.3 67 Small Hydropower 7.0 40.1 44.3 68 Hybrid Cars 6.9 39.2 43.2 69 Electric Bicycles 5.9 33.8 37.3 70 Biochar Production 5.8 33.1 36.5 71 Sustainable Intensification for Smallholders 5.8 33.1 36.5 72 Bioplastics 5.7 32.4 35.7 73 Ocean Power 5.4 30.9 34.1 74 High-Speed Rail 5.4 30.7 33.8 75 Coastal Wetland Protection 5.1 29.2 32.2 76 Farm Irrigation Efficiency 4.8 27.5 30.4 77 Composting 4.8 27.5 30.4 78 Improved Fisheries 4.3 24.6 27.1 79 Low-Flow Fixtures 4.0 22.6 25.0 80 Coastal Wetland Restoration 3.2 18.5 20.4 81 Water Distribution Efficiency 2.6 14.8 16.4 82 Green and Cool Roofs 2.3 12.9 14.2 83 Recycled Plastics 2.2 12.6 14.0 84 Improved Aquaculture 2.1 12.2 13.4 85 Dynamic Glass 1.4 8.3 9.1 86 Micro Wind Turbines 0.4 2.2 2.4
Source: Project Drawdown, Japan Tourism Agency, Worldometer, World Bank Data, ECTA, and our calculations
Note: Calculations based on Scenario 1 of Project Drawdown
Note: CO2 emissions reductions per capita are calculated based on Scenario 1 of Project Drawdown and the world population. “Reduced 20kg luggage” is the CO2 emissions reduction effect of stopping loading 20kg of luggage on airplanes when traveling to Japan (one-way average from 19 countries).
Comparing this reduction of 137 kg to 86 different CO2 reduction projects proposed by “Project Drawdown,” it is the 9th per capita worldwide, the 44th per capita in the OECD, and the 46th per capita in high-income countries. This is a pretty good ranking among the “100 Ways to Reverse Global Warming” selected by the world’s scientists. The effect of reducing the amount of luggage carried on board airplanes is extremely significant.
Moreover, the “Project Drawdown” includes the projects of CO2 reduction by 2050, even by using incomplete technology. We can do right now to reduce the amount of luggage carried on board airplanes. Furthermore, reducing the amount of baggage carried on board eliminates the need to prepare, transport, wash and put away clothing. It also makes travel easier for the elderly, the disabled, and families with children to bridge the travel divide. Let’s start immediately to reduce the amount of luggage carried on board airplanes, which is a good thing.