CO2削減プロジェクト86種類と飛行機に荷物を搭載しない効果との比較
目次
1:「Project Drawdown」とは
2:1人当たり1日当たりのCO2排出量の削減効果比較
3:1人当たり1年間当たりのCO2排出量の削減効果比較
1:「Project Drawdown」とは
「このデータを見てもまだ荷物を飛行機に持ち込みますか?」では、主に日本の環境省のデータを用いて1人1日当たりのCO2排出量削減比較を行いました。今回は「Project Drawdown」のデータを用いて、より多くのCO2排出量削減効果との比較を行います。
「Project Drawdown」では、190人の研究者・専門家・科学者の国際的なグループが結集し、気候変動に対する現実的かつ大胆な解決策をまとめ、「Drawdown: The Most Comprehensive Plan Ever Proposed to Reverse Global Warming(邦題:DRAWDOWNドローダウン― 地球温暖化を逆転させる100の方法)」という本を出版しました。世界をリードする科学者と政策立案者の綿密な調査に基づき2020年から2050年までの解決策を網羅した本として、世界中で高く評価されています。
「Project Drawdown」の最新データは「https://drawdown.org」で見ることができます。当社ではこの最新データを用いて、日本旅行時の飛行機への20kg荷物搭載を止めた場合に得られるCO2排出量削減効果を、同書が提案する気候変動の各対策と比較しました。当社が使用したデータはScenario 1です。Scenario 1とは2100年までに気温上昇を2度に抑えるシナリオです。「Project Drawdown」には1.5度までに気温上昇を抑えるScenario 2も併記されています。
CO2排出量の削減効果(Drawdown Scenario 1 and 2)
SOLUTION SECTOR(S) SCENARIO 1 SCENARIO 2 Gigatons CO2 Equivalent Reduced / Sequestered (2020–2050) 1 Reduced Food Waste Food, Agriculture, and Land Use / Land Sinks 88.5 102.2 2 Plant-Rich Diets Food, Agriculture, and Land Use / Land Sinks 78.3 103.1 3 Family Planning and Education Health and Education 68.9 68.9 4 Refrigerant Management Industry / Buildings 57.2 57.2 5 Tropical Forest Restoration Land Sinks 54.5 85.1 6 Onshore Wind Turbines Electricity 47.0 143.6 7 Alternative Refrigerants Industry / Buildings 42.7 48.8 8 Utility-Scale Solar Photovoltaics Electricity 40.8 111.6 9 Clean Cooking Buildings 31.4 76.3 10 Distributed Solar Photovoltaics Electricity 26.7 64.9 11 Silvopasture Land Sinks 26.6 42.3 12 Methane Leak Management Other Energy 25.8 31.3 13 Peatland Protection and Rewetting Food, Agriculture, and Land Use / Land Sinks 25.4 40.3 14 Tree Plantations (on Degraded Land) Land Sinks 22.0 35.1 15 Temperate Forest Restoration Land Sinks 19.4 27.9 16 Concentrated Solar Power Electricity 18.0 21.5 17 Perennial Staple Crops Land Sinks 16.3 32.9 18 Insulation Electricity / Buildings 15.4 18.5 19 Regenerative Annual Cropping Food, Agriculture, and Land Use / Land Sinks 15.1 23.2 20 Tree Intercropping Land Sinks 15.0 24.4 21 LED Lighting Electricity 14.5 15.7 22 Managed Grazing Land Sinks 13.7 20.9 23 Multistrata Agroforestry Land Sinks 13.3 23.9 24 Conservation Agriculture Food, Agriculture, and Land Use / Land Sinks 12.8 8.1 25 Abandoned Farmland Restoration Land Sinks 12.5 20.3 26 Recycling Industry 10.4 11.3 27 Offshore Wind Turbines Electricity 10.2 9.9 28 Improved Rice Production Food, Agriculture, and Land Use / Land Sinks 9.9 14.4 29 Building Automation Systems Electricity / Buildings 9.6 14.0 30 Public Transit Transportation 9.4 15.4 31 Efficient Trucks Transportation 9.2 10.8 32 Carpooling Transportation 9.1 11.1 33 High-Performance Glass Electricity / Buildings 8.8 11.3 34 Indigenous Peoples’ Forest Tenure Food, Agriculture, and Land Use / Land Sinks 8.7 12.5 35 Bamboo Production Land Sinks 7.7 19.6 36 Alternative Cement Industry 7.7 15.6 37 Electric Cars Transportation 7.7 9.8 38 Smart Thermostats Electricity / Buildings 6.9 7.3 39 Efficient Ocean Shipping Transportation 6.7 9.8 40 Waste to Energy Electricity / Industry 6.3 5.2 41 District Heating Electricity / Buildings 6.2 9.7 42 Geothermal Power Electricity 6.2 9.2 43 Methane Digesters Electricity / Industry 6.0 7.1 44 Forest Protection Food, Agriculture, and Land Use / Land Sinks 5.6 8.8 45 Efficient Aviation Transportation 5.3 5.8 46 Biogas for Cooking Buildings 4.7 9.7 47 Improved Cattle Feed Food, Agriculture, and Land Use 4.4 15.1 48 Recycled Metals Industry 4.3 12.3 49 High-Efficiency Heat Pumps Electricity / Buildings 4.0 9.1 50 Perennial Biomass Production Land Sinks 4.0 7.0 51 Seafloor Protection Food, Agriculture, and Land Use 3.8 5.1 52 Reduced Plastics Industry 3.8 5.4 53 Solar Hot Water Electricity / Buildings 3.4 13.7 54 Grassland Protection Food, Agriculture, and Land Use / Land Sinks 3.4 4.3 55 Improved Manure Management Food, Agriculture, and Land Use 3.3 6.1 56 Nuclear Power Electricity 3.2 3.6 57 System of Rice Intensification Food, Agriculture, and Land Use / Land Sinks 2.9 4.4 58 Walkable Cities Transportation 2.8 3.5 59 Nutrient Management Food, Agriculture, and Land Use 2.8 11.5 60 Bicycle Infrastructure Transportation 2.7 4.6 61 Telepresence Transportation 2.6 4.4 62 Biomass Power Electricity 2.6 3.6 63 Macroalgae Protection and Restoration Coastal and Ocean Sinks 2.6 3.8 64 Seaweed Farming Coastal and Ocean Sinks / Coastal and Ocean Sinks 2.5 4.7 65 Recycled Paper Industry 2.3 2.9 66 Electric Trains Transportation 1.9 3.3 67 Small Hydropower Electricity 1.7 3.2 68 Hybrid Cars Transportation 1.6 4.7 69 Electric Bicycles Transportation 1.4 1.6 70 Biochar Production Engineered Sinks 1.4 3.0 71 Sustainable Intensification for Smallholders Food, Agriculture, and Land Use / Land Sinks 1.4 0.7 72 Bioplastics Industry 1.3 2.5 73 Ocean Power Electricity 1.3 0.8 74 High-Speed Rail Transportation 1.3 3.6 75 Coastal Wetland Protection Food, Agriculture, and Land Use / Coastal and Ocean Sinks 1.2 1.6 76 Farm Irrigation Efficiency Food, Agriculture, and Land Use 1.1 2.1 77 Composting Industry 1.1 1.4 78 Improved Fisheries Food, Agriculture, and Land Use / Coastal and Ocean Sinks 1.0 1.5 79 Low-Flow Fixtures Electricity / Buildings 0.9 1.5 80 Coastal Wetland Restoration Coastal and Ocean Sinks 0.8 1.0 81 Water Distribution Efficiency Electricity 0.6 0.9 82 Green and Cool Roofs Electricity / Buildings 0.5 1.0 83 Recycled Plastics Industry 0.5 1.7 84 Improved Aquaculture Food, Agriculture, and Land Use 0.5 0.8 85 Dynamic Glass Electricity / Buildings 0.3 0.5 86 Micro Wind Turbines Electricity 0.1 0.1 Total 1,047.0 1,638.7
出所:Project Drawdown

2:1人当たり1日当たりのCO2排出量の削減効果比較
「Project Drawdown」の1人当たりCO2排出量削減効果を計算するにあたり、2020年時点の世界人口(78.2億人)、OECDの人口(13.7億人)、High income国の人口(12.4億人)の3パターンを使用しました。OECDの人口やHigh income国の人口を使用したのは、世界のCO2排出量は先進国がより多いため、その削減余地も先進国が大きいと考えるためです。なお、2019年データでは世界のCO2排出量に占める割合はOECDが34%、High income国が35%です。
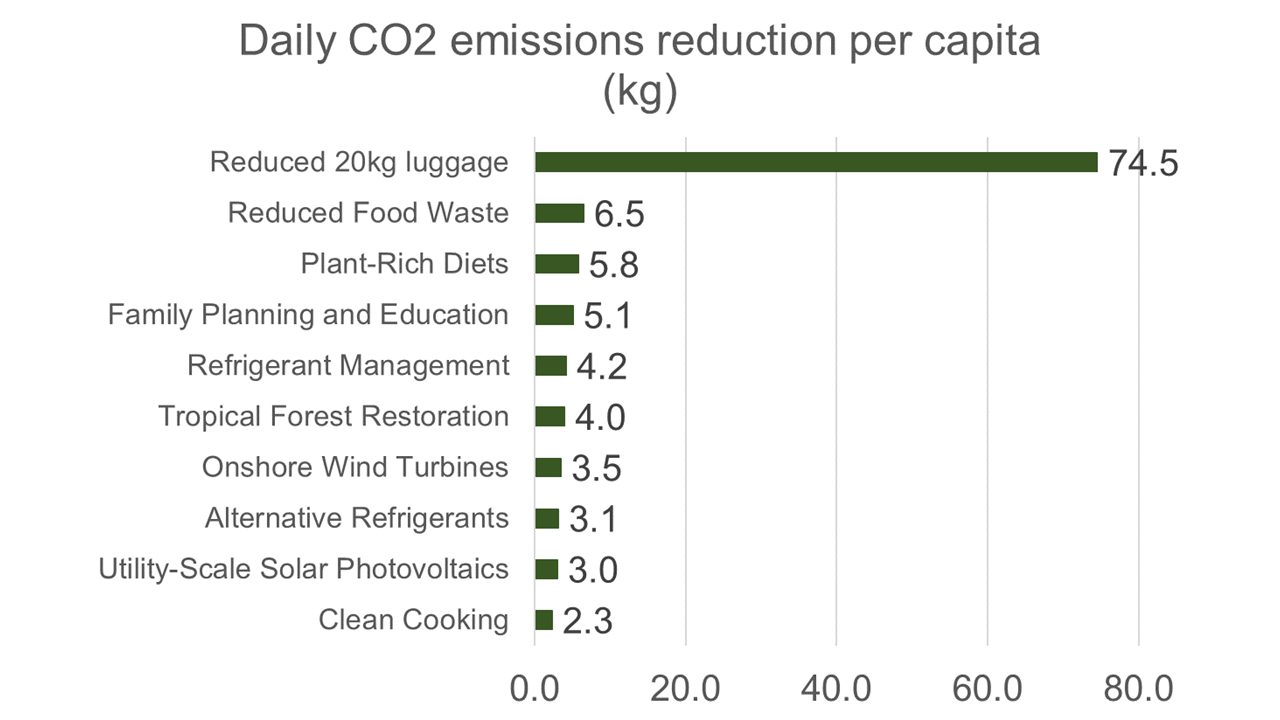
「Project Drawdown」に記載されているCO2削減プロジェクト86種類(Scenario 1のデータ)を1人1日当たりのCO2削減量として計算すると、最大の削減効果は「Reduced Food Waste(食品ロス削減)」、2番目に大きな効果は「Plant-Rich Diets(植物性食品を多く含む食事)」でした。「Reduced Food Waste(食品ロス削減)」の1日当たりCO2排出量の削減効果は、世界人口の1人当たり1.0kg、OECD人口の1人当たり5.9kg、High income国人口の1人当たり6.5kgとなります。
「このデータを見てもまだ荷物を飛行機に持ち込みますか?」で分析したように、日本旅行時の飛行機への20kg荷物搭載を止めた場合のCO2排出量削減効果(世界19か国からの片道平均)は74.5kgです。これは「Project Drawdown」に記載されたあらゆるCO2排出量の削減効果と比較し10倍以上の効果となります。
1人当たり1日当たりのCO2排出量の削減効果 (kg)
SOLUTION World population OECD poluration High income population Reduced 20kg luggage (One way to Japan) 74.50 74.50 74.50 Reduced Food Waste 1.03 5.90 6.51 Plant-Rich Diets 0.91 5.22 5.76 Family Planning and Education 0.80 4.59 5.07 Refrigerant Management 0.67 3.81 4.21 Tropical Forest Restoration 0.64 3.63 4.01 Onshore Wind Turbines 0.55 3.13 3.46 Alternative Refrigerants 0.50 2.85 3.14 Utility-Scale Solar Photovoltaics 0.48 2.72 3.00 Clean Cooking 0.37 2.09 2.31 Distributed Solar Photovoltaics 0.31 1.78 1.96 Silvopasture 0.31 1.77 1.96 Methane Leak Management 0.30 1.72 1.90 Peatland Protection and Rewetting 0.30 1.69 1.87 Tree Plantations (on Degraded Land) 0.26 1.47 1.62 Temperate Forest Restoration 0.23 1.29 1.43 Concentrated Solar Power 0.21 1.20 1.32 Perennial Staple Crops 0.19 1.09 1.20 Insulation 0.18 1.03 1.13 Regenerative Annual Cropping 0.18 1.01 1.11 Tree Intercropping 0.18 1.00 1.11 LED Lighting 0.17 0.96 1.06 Managed Grazing 0.16 0.91 1.01 Multistrata Agroforestry 0.15 0.88 0.98 Conservation Agriculture 0.15 0.85 0.94 Abandoned Farmland Restoration 0.15 0.83 0.92 Recycling 0.12 0.69 0.76 Offshore Wind Turbines 0.12 0.68 0.75 Improved Rice Production 0.12 0.66 0.72 Building Automation Systems 0.11 0.64 0.70 Public Transit 0.11 0.63 0.69 Efficient Trucks 0.11 0.61 0.67 Carpooling 0.11 0.60 0.67 High-Performance Glass 0.10 0.59 0.65 Indigenous Peoples’ Forest Tenure 0.10 0.58 0.64 Bamboo Production 0.09 0.51 0.57 Alternative Cement 0.09 0.51 0.57 Electric Cars 0.09 0.51 0.56 Smart Thermostats 0.08 0.46 0.51 Efficient Ocean Shipping 0.08 0.45 0.49 Waste to Energy 0.07 0.42 0.46 District Heating 0.07 0.41 0.45 Geothermal Power 0.07 0.41 0.45 Methane Digesters 0.07 0.40 0.44 Forest Protection 0.06 0.37 0.41 Efficient Aviation 0.06 0.35 0.39 Biogas for Cooking 0.05 0.31 0.34 Improved Cattle Feed 0.05 0.29 0.33 Recycled Metals 0.05 0.29 0.32 High-Efficiency Heat Pumps 0.05 0.27 0.30 Perennial Biomass Production 0.05 0.27 0.29 Seafloor Protection 0.04 0.25 0.28 Reduced Plastics 0.04 0.25 0.28 Solar Hot Water 0.04 0.23 0.25 Grassland Protection 0.04 0.22 0.25 Improved Manure Management 0.04 0.22 0.25 Nuclear Power 0.04 0.21 0.23 System of Rice Intensification 0.03 0.19 0.21 Walkable Cities 0.03 0.19 0.21 Nutrient Management 0.03 0.18 0.20 Bicycle Infrastructure 0.03 0.18 0.20 Telepresence 0.03 0.18 0.19 Biomass Power 0.03 0.17 0.19 Macroalgae Protection and Restoration 0.03 0.17 0.19 Seaweed Farming 0.03 0.17 0.18 Recycled Paper 0.03 0.15 0.17 Electric Trains 0.02 0.13 0.14 Small Hydropower 0.02 0.11 0.12 Hybrid Cars 0.02 0.11 0.12 Electric Bicycles 0.02 0.09 0.10 Biochar Production 0.02 0.09 0.10 Sustainable Intensification for Smallholders 0.02 0.09 0.10 Bioplastics 0.02 0.09 0.10 Ocean Power 0.01 0.08 0.09 High-Speed Rail 0.01 0.08 0.09 Coastal Wetland Protection 0.01 0.08 0.09 Farm Irrigation Efficiency 0.01 0.08 0.08 Composting 0.01 0.08 0.08 Improved Fisheries 0.01 0.07 0.07 Low-Flow Fixtures 0.01 0.06 0.07 Coastal Wetland Restoration 0.01 0.05 0.06 Water Distribution Efficiency 0.01 0.04 0.04 Green and Cool Roofs 0.01 0.04 0.04 Recycled Plastics 0.01 0.03 0.04 Improved Aquaculture 0.01 0.03 0.04 Dynamic Glass 0.004 0.02 0.03 Micro Wind Turbines 0.001 0.01 0.01
出所:Project Drawdown、観光庁、Worldometer、World Bank Data、ECTA、当社計算
注:Project DrawdownのScenario 1により計算
出所:Project Drawdown、観光庁、Worldometer、World Bank Data、ECTA、当社計算
注:一人当たり削減量はProject DrawdownのScenario 1、High income国の人口により計算、「Reduced 20kg luggage」は日本旅行における飛行機に20kgの荷物搭載を止めた場合のCO2排出量の削減効果(世界19か国からの片道平均)
3:1人当たり1年間当たりのCO2排出量の削減効果比較
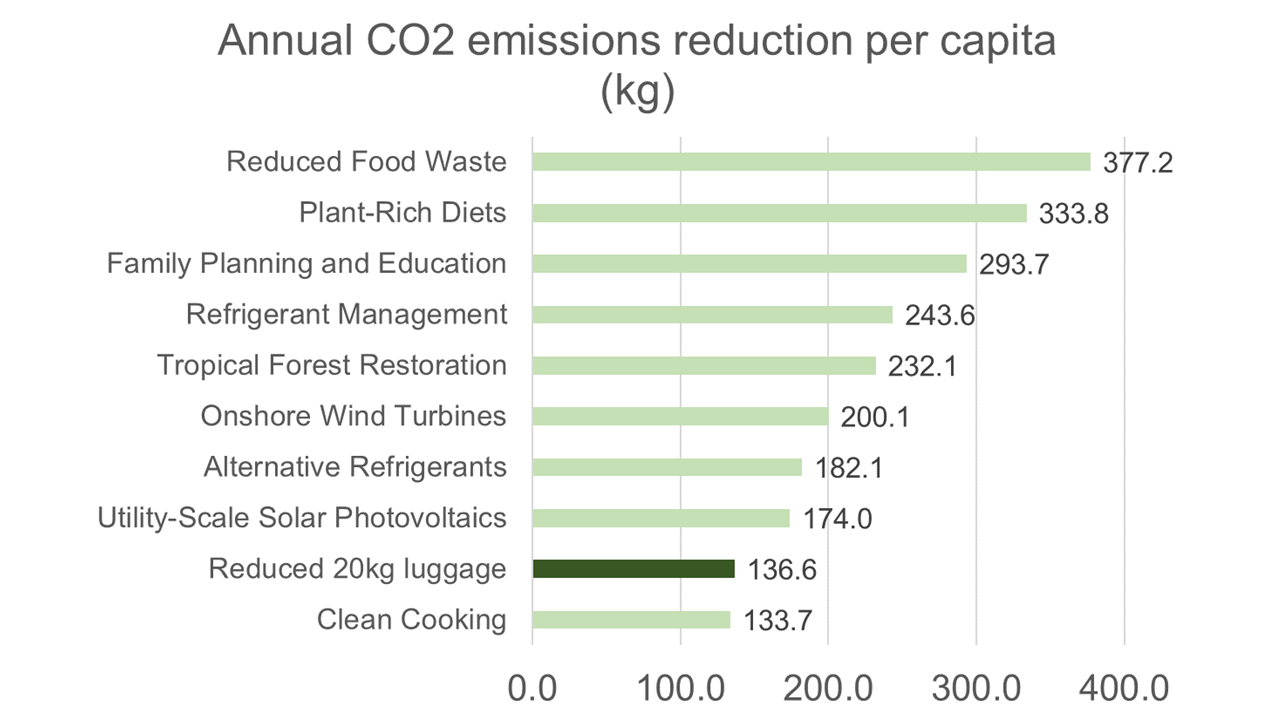
日本の観光庁の「訪日外国人の消費動向(2019年)」 によれば、1年間当たりの外国人の訪日回数は平均1.8回でした。世界19ヵ国からの飛行距離・訪日客数・1年間当たりの訪日回数で計算すると、1人の旅行者が20kgの荷物を飛行機に搭載しないことで得られる1年間当たり(平均1.8回)のCO2排出量の削減効果は137kgとなりました。
1人当たり1年間当たりのCO2排出量の削減効果 (kg)
SOLUTION World population OECD poluration High income population 1 Reduced Food Waste 377.2 2,152.9 2,377.3 2 Plant-Rich Diets 333.8 1,905.5 2,104.1 3 Family Planning and Education 293.7 1,676.1 1,850.8 4 Refrigerant Management 243.6 1,390.3 1,535.2 5 Tropical Forest Restoration 232.1 1,324.6 1,462.6 6 Onshore Wind Turbines 200.1 1,142.1 1,261.2 7 Alternative Refrigerants 182.1 1,039.5 1,147.8 8 Utility-Scale Solar Photovoltaics 174.0 993.3 1,096.8 Reduced 20kg luggage (1.8 round-trip to Japan) 136.6 9 Clean Cooking 133.7 763.4 842.9 10 Distributed Solar Photovoltaics 113.6 648.3 715.9 11 Silvopasture 113.3 646.6 714.0 12 Methane Leak Management 110.1 628.4 693.9 13 Peatland Protection and Rewetting 108.3 617.9 682.3 14 Tree Plantations (on Degraded Land) 93.9 536.2 592.0 15 Temperate Forest Restoration 82.8 472.4 521.7 16 Concentrated Solar Power 76.7 437.9 483.5 17 Perennial Staple Crops 69.6 397.5 438.9 18 Insulation 65.6 374.1 413.1 19 Regenerative Annual Cropping 64.4 367.8 406.2 20 Tree Intercropping 64.1 365.6 403.7 21 LED Lighting 61.6 351.5 388.2 22 Managed Grazing 58.5 333.8 368.5 23 Multistrata Agroforestry 56.5 322.6 356.2 24 Conservation Agriculture 54.6 311.6 344.1 25 Abandoned Farmland Restoration 53.2 303.6 335.2 26 Recycling 44.2 252.0 278.3 27 Offshore Wind Turbines 43.6 248.6 274.5 28 Improved Rice Production 42.0 239.6 264.6 29 Building Automation Systems 40.7 232.3 256.5 30 Public Transit 40.1 229.2 253.0 31 Efficient Trucks 39.0 222.6 245.8 32 Carpooling 38.6 220.4 243.4 33 High-Performance Glass 37.6 214.6 236.9 34 Indigenous Peoples’ Forest Tenure 37.0 211.4 233.4 35 Bamboo Production 32.8 187.3 206.8 36 Alternative Cement 32.8 187.3 206.8 37 Electric Cars 32.6 186.3 205.8 38 Smart Thermostats 29.5 168.1 185.6 39 Efficient Ocean Shipping 28.6 163.5 180.5 40 Waste to Energy 26.7 152.5 168.4 41 District Heating 26.3 150.3 166.0 42 Geothermal Power 26.2 149.6 165.2 43 Methane Digesters 25.7 146.4 161.7 Reduced 20kg luggage (1.8 round-trip to Japan) 136.6 44 Forest Protection 23.7 135.0 149.1 45 Efficient Aviation 22.5 128.7 142.1 Reduced 20kg luggage (1.8 round-trip to Japan) 136.6 46 Biogas for Cooking 19.8 113.1 124.9 47 Improved Cattle Feed 18.8 107.5 118.7 48 Recycled Metals 18.4 104.8 115.8 49 High-Efficiency Heat Pumps 17.2 98.3 108.5 50 Perennial Biomass Production 17.0 97.3 107.4 51 Seafloor Protection 16.2 92.4 102.1 52 Reduced Plastics 16.0 91.5 101.0 53 Solar Hot Water 14.5 83.0 91.6 54 Grassland Protection 14.3 81.5 90.0 55 Improved Manure Management 14.2 81.3 89.7 56 Nuclear Power 13.5 77.1 85.2 57 System of Rice Intensification 12.4 70.5 77.9 58 Walkable Cities 12.1 68.8 76.0 59 Nutrient Management 11.8 67.4 74.4 60 Bicycle Infrastructure 11.6 66.4 73.3 61 Telepresence 11.3 64.2 70.9 62 Biomass Power 11.2 63.7 70.4 63 Macroalgae Protection and Restoration 11.1 63.5 70.1 64 Seaweed Farming 10.7 60.8 67.2 65 Recycled Paper 9.7 55.5 61.2 66 Electric Trains 8.1 46.5 51.3 67 Small Hydropower 7.0 40.1 44.3 68 Hybrid Cars 6.9 39.2 43.2 69 Electric Bicycles 5.9 33.8 37.3 70 Biochar Production 5.8 33.1 36.5 71 Sustainable Intensification for Smallholders 5.8 33.1 36.5 72 Bioplastics 5.7 32.4 35.7 73 Ocean Power 5.4 30.9 34.1 74 High-Speed Rail 5.4 30.7 33.8 75 Coastal Wetland Protection 5.1 29.2 32.2 76 Farm Irrigation Efficiency 4.8 27.5 30.4 77 Composting 4.8 27.5 30.4 78 Improved Fisheries 4.3 24.6 27.1 79 Low-Flow Fixtures 4.0 22.6 25.0 80 Coastal Wetland Restoration 3.2 18.5 20.4 81 Water Distribution Efficiency 2.6 14.8 16.4 82 Green and Cool Roofs 2.3 12.9 14.2 83 Recycled Plastics 2.2 12.6 14.0 84 Improved Aquaculture 2.1 12.2 13.4 85 Dynamic Glass 1.4 8.3 9.1 86 Micro Wind Turbines 0.4 2.2 2.4
出所:Project Drawdown、観光庁、Worldometer、World Bank Data、ECTA、当社計算
注:Project DrawdownのScenario 1により計算
注:一人当たり削減量はProject DrawdownのScenario 1、世界人口により計算、「Reduced 20kg luggage」は日本旅行における飛行機に20kgの荷物搭載を止めた場合のCO2排出量の削減効果(世界19か国からの片道平均)
この削減効果137kgを「Project Drawdown」が提案するCO2削減プロジェクト86種類の効果と比較すると、世界人口当たりでは9番目、OECDの人口当たりでは44番目、High income国の人口当たりでは46番目の効果となりました。世界の科学者が厳選した「地球温暖化を逆転させる100の方法」の中でもかなり良い順位です。飛行機への搭載荷物削減効果は、極めて大きいと言えるのではないでしょうか。
しかも「Project Drawdown」には、未完成の技術などを利用した上での2050年までのCO2削減効果も含まれています。飛行機への搭載荷物削減は今すぐできる施策です。更に飛行機への搭載荷物削減により、荷物の準備・運搬・衣類の洗濯・片付けが不要になります。また、高齢者や障害者、子連れ家族など移動困難者が旅行をしやすくなるため、トラベルディバイドを解消できます。良いこと尽くしの飛行機への搭載荷物削減を、すぐにでも実行しようではありませんか。

Follow me!